Documentation Index
Fetch the complete documentation index at: https://docs.edel.finance/llms.txt
Use this file to discover all available pages before exploring further.
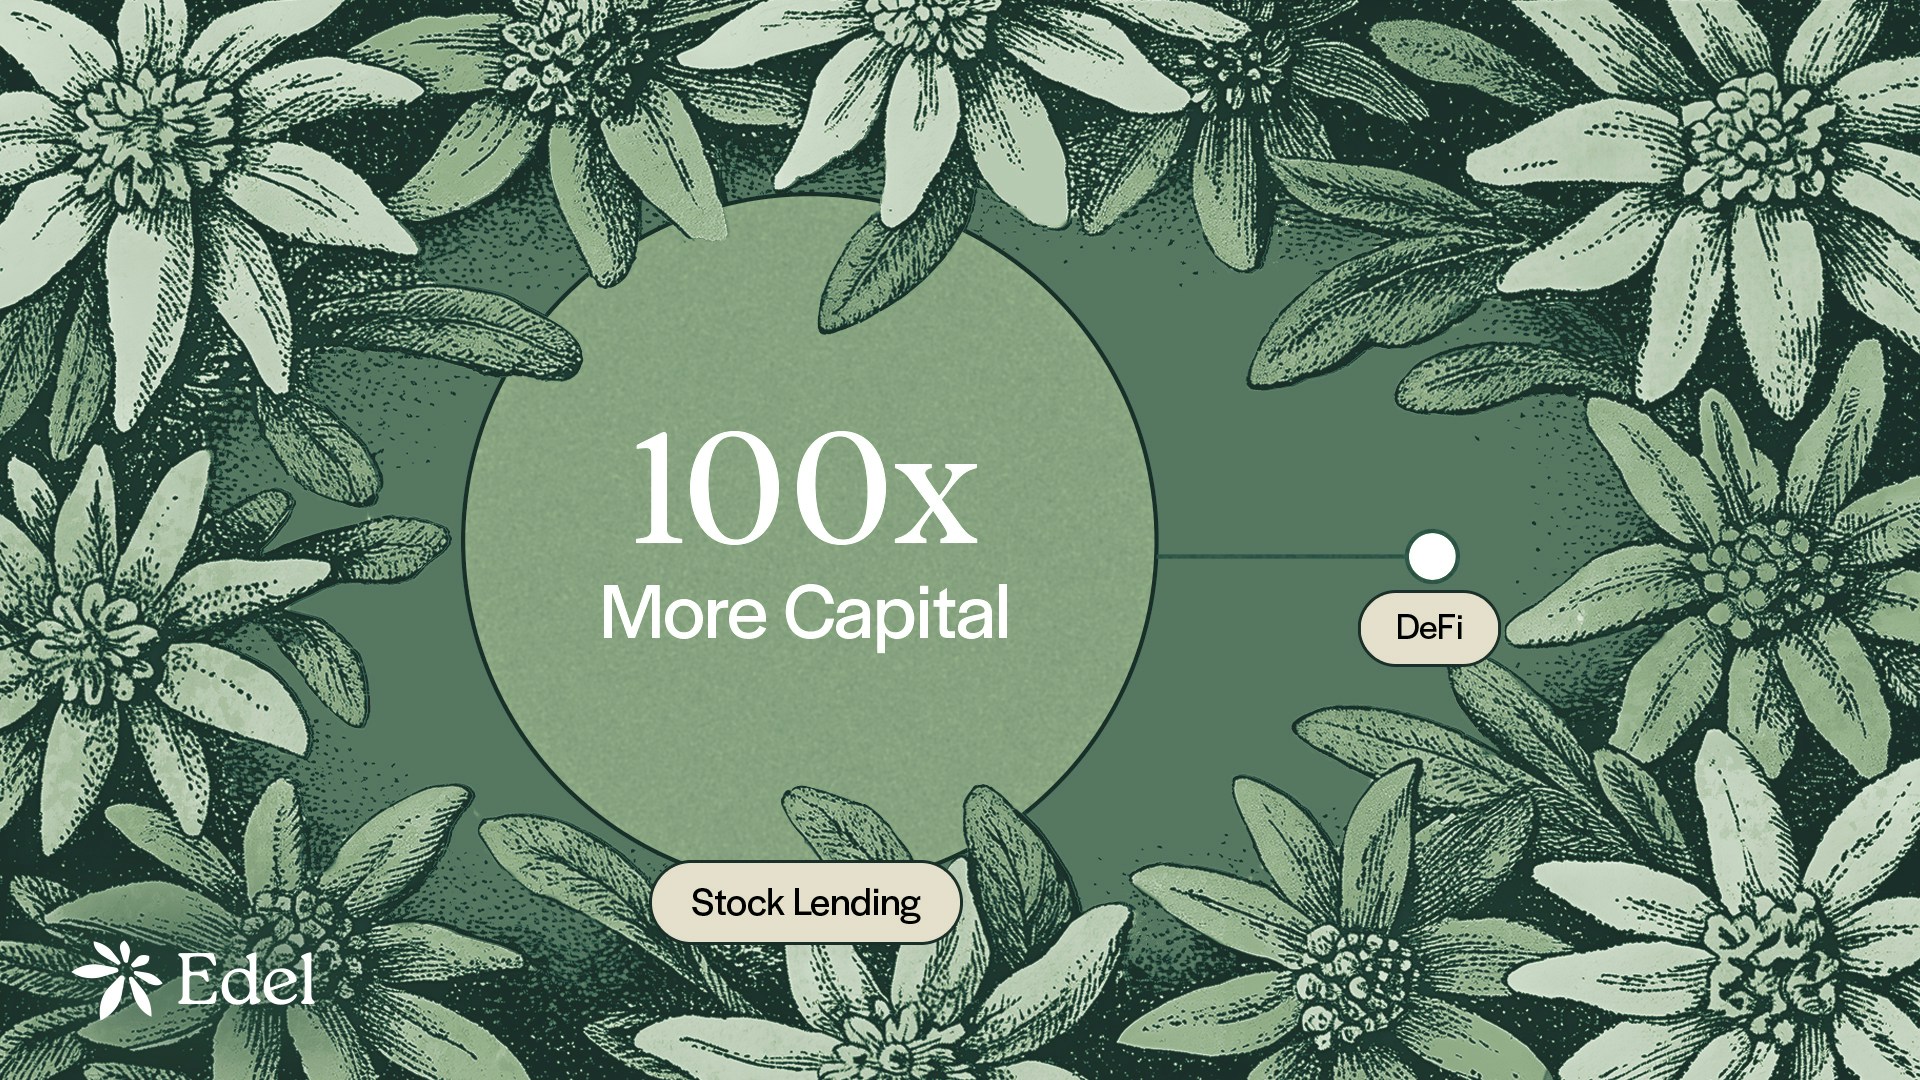
The Base and the Gap
Programmed Demand
~$2.6T in stocks already on loan. Proof that borrow appetite is persistent and institutional.
Captured Spread
~$10.3B in 2024 revenue parked in broker hands, mapped to an ~0.40% average lend fee ripe for redistribution.
Regulators Plugging In
SEC forward guidance and global regulations are primed to unleash large-scale tokenisation of equities.
Why This Tips Now
Tokenisation Goes Mainstream
Public companies, banks, and issuers are mapping securities to onchain primitives, demanding venues that clear, price, and report natively onchain.
Wallets Expect Yield
Crypto-native investors already demand transparent APY, instant exits, and composability; they migrate the moment securities markets offer the same.
Balance Sheets Need Income
Treasuries and broker desks are under pressure to unlock new spread; tokenised equities with real-time settlement enable basis, hedge, and short-cover trades they can’t ignore.
Market Effects
Borrow Costs Compress
Unified liquidity pools surface real supply and demand, forcing borrow rates toward market-clearing levels instead of opaque broker quotes.
Idle Collateral Activates
Trusted rails spin dormant equity inventory into productive vaults, expanding liquidity without layering hidden leverage.
The migration is already underway. Edel is the neutral switch that routes the next $10B+ in securities lending revenue straight to the wallets supplying the assets.