Documentation Index
Fetch the complete documentation index at: https://docs.edel.finance/llms.txt
Use this file to discover all available pages before exploring further.
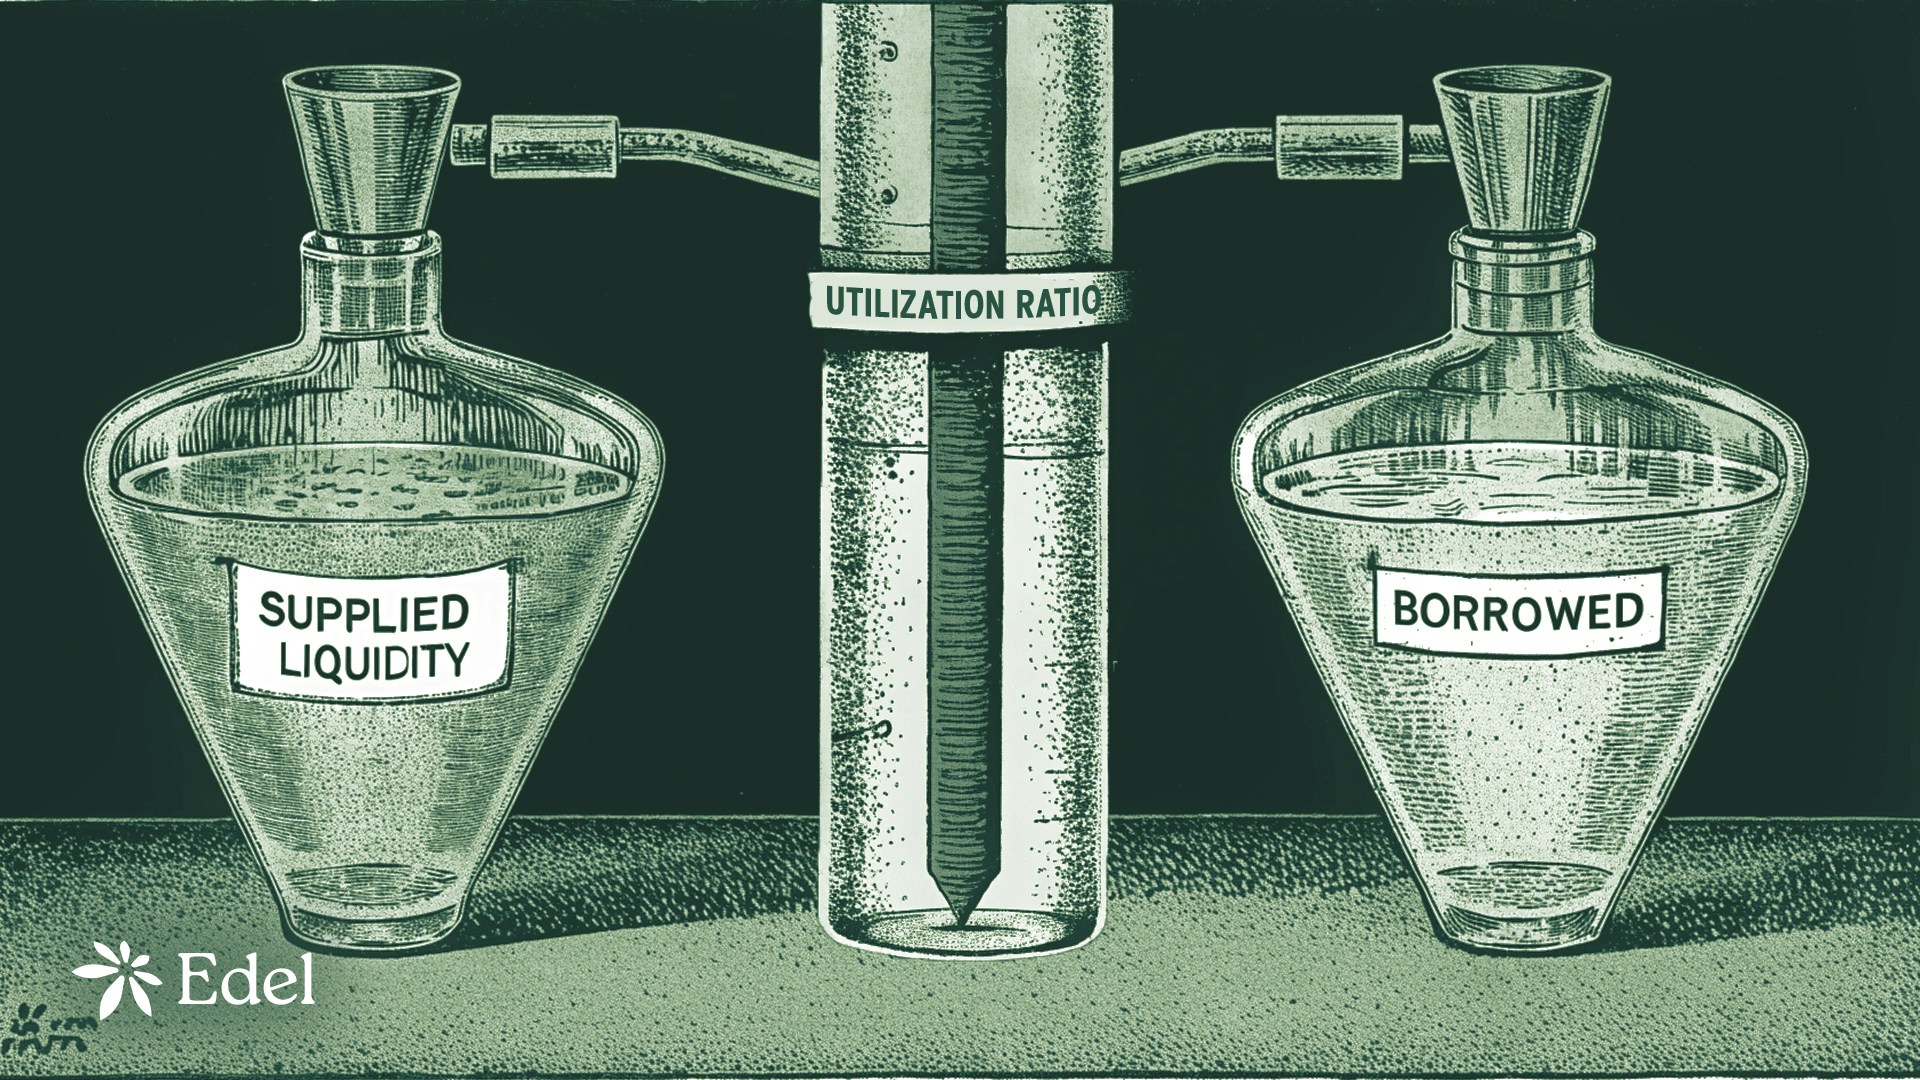
Understanding Utilization Ratio
The utilization ratio shows how much of a market’s liquidity is currently being borrowed. It’s a simple but powerful metric that drives all interest rates in Edel Finance. Utilization Ratio = Total Borrowed ÷ Total Supplied For example, if a USDC market has:- $10 million supplied
- $7 million borrowed
- Utilization ratio = 70%
Higher utilization means more demand for borrowing, which automatically increases interest rates for both suppliers and borrowers.
How Interest Rates Are Calculated
Edel Finance uses a two-slope interest rate model that responds to market conditions:The Two-Slope System
Slope 1: Low to Optimal Utilization- Gradual rate increases as utilization rises
- Encourages steady borrowing activity
- Typically covers 0% to 80% utilization
- Steep rate increases to protect liquidity
- Discourages excessive borrowing
- Covers 80% to 100% utilization
- Low Utilization (0-80%)
- High Utilization (80-100%)
Borrow Rate: Increases gradually
Supply Rate: Modest increases
Market Condition: Healthy liquidity available
Supply Rate: Modest increases
Market Condition: Healthy liquidity available
Real-World Example
Let’s see how rates change in a USDC market: At 50% Utilization:- Borrow Rate: 3% APY
- Supply Rate: 1.5% APY
- Plenty of liquidity available
- Borrow Rate: 8% APY
- Supply Rate: 6.8% APY
- Limited liquidity, higher rates
What Affects Your Earnings
As a Supplier
Your earnings come from two sources: Interest Payments: You earn a share of the interest paid by borrowers- Formula: Average Borrow Rate × Utilization Ratio × Your Share
- Higher utilization = higher earnings
As a Borrower
Your interest costs increase with:- Higher utilization in the market
- Time (interest accrues continuously)
- Market volatility (affects demand)
Market Dynamics
Low Utilization Markets
Benefits: Lower borrow costs, high liquidity
Drawbacks: Lower supply yields
Drawbacks: Lower supply yields
High Utilization Markets
Benefits: Higher supply yields
Drawbacks: Higher borrow costs, withdrawal risks
Drawbacks: Higher borrow costs, withdrawal risks
Optimal Usage Ratio
Each market has an optimal usage ratio (typically around 80%) where:- Borrowing costs remain reasonable
- Suppliers earn attractive yields
- Sufficient liquidity remains available
- Risk is balanced
Interest Rate Parameters
Interest Rate Parameters
Explore the detailed parameters that control interest rate calculations, including base rates, slopes, and asset-specific configurations.
Interest rates update automatically with every transaction, ensuring fair market-driven pricing at all times.